PairSpaces for Data Science
Exploring and visualizing data together
PairSpaces makes working together to explore, understand, analyze, and visualize data faster and better than anything you've used before. Using a Git-first approach to collaboration, PairSpaces makes collaboration a zero-friction experience.
Working Together to Analyze Customer Churn Data
Alice and Bob are two data scientists exploring a customer churn dataset. Alice is tasked with building a data profiling dashboard and Bob is experimenting how to visualize churn. They want to present their work at a meeting with their product marketing team.
Let's see how they work together on this dataset.
Setting Up
To follow along in your Space, you need to install the following dependencies.
> sudo yum -y install git
> curl -O https://bootstrap.pypa.io/get-pip.py
> python3 get-pip.py --userEach Space has its own storage volume available from /space.
> cd /space
> mkdir churn-dataset
> mkdir worktrees
> cd churn-dataset
Initial Data
Set up a new Git repository...
> git init .
> git branch -M main
...and add the churn dataset...
# data/churn.csv
CustomerID,Age,Plan,MonthlyCharges,Churn
001,23,Basic,29.99,Yes
002,45,Premium,89.99,No
003,35,Pro,49.99,Yes
004,29,Pro,59.99,No
005,54,Premium,109.99,No
006,31,Basic,19.99,Yes
007,42,Pro,69.99,No
008,26,Basic,24.99,Yes
...and make the initial commit...
> git add .
> git commit -m "feat: initial commit"
Set up Worktrees
This is the current state of the repository:
churn-dataset/
├── data/
│   ├── churn.csv
worktrees/
# Alice
> git worktree add -b feat/profile ../worktrees/profile
Preparing worktree (new branch 'feat/profile')
HEAD is now at 48cdaf5 feat: initial commit
> cd ../worktrees/profile
# Bob
> git worktree add -b feat/visualization ../worktrees/visualization
Preparing worktree (new branch 'feat/visualization')
HEAD is now at 48cdaf5 feat: initial commit
> cd ../worktrees/visualizationAlice Creates a Profile Report
From her worktree Alice uses ydata_profiling to create a report. First, Alice adds her dependencies...
> pip install seaborn matplotlib ydata-profiling streamlit streamlit-pandas-profiling...then creates the report...
# app.py
import streamlit as st
import pandas as pd
from ydata_profiling import ProfileReport
from streamlit_pandas_profiling import st_profile_report

st.title("Churn Dashboard")

# Load data
df = pd.read_csv("data/churn.csv")

# Create profile
profile = ProfileReport(df, title="Churn Dataset Profile", explorative=True)

# Display in Streamlit
st_profile_report(profile)
...and finally commits her change...
> git add .
> git commit -m "feat: profiled customer churn data"
[feat/profile 070f89b] feat: profiled customer churn data
 1 file changed, 17 insertions(+)
 create mode 100644 app.py
Alice can view this Streamlit application using VSCode's Open in Browser feature:
> streamlit run app.py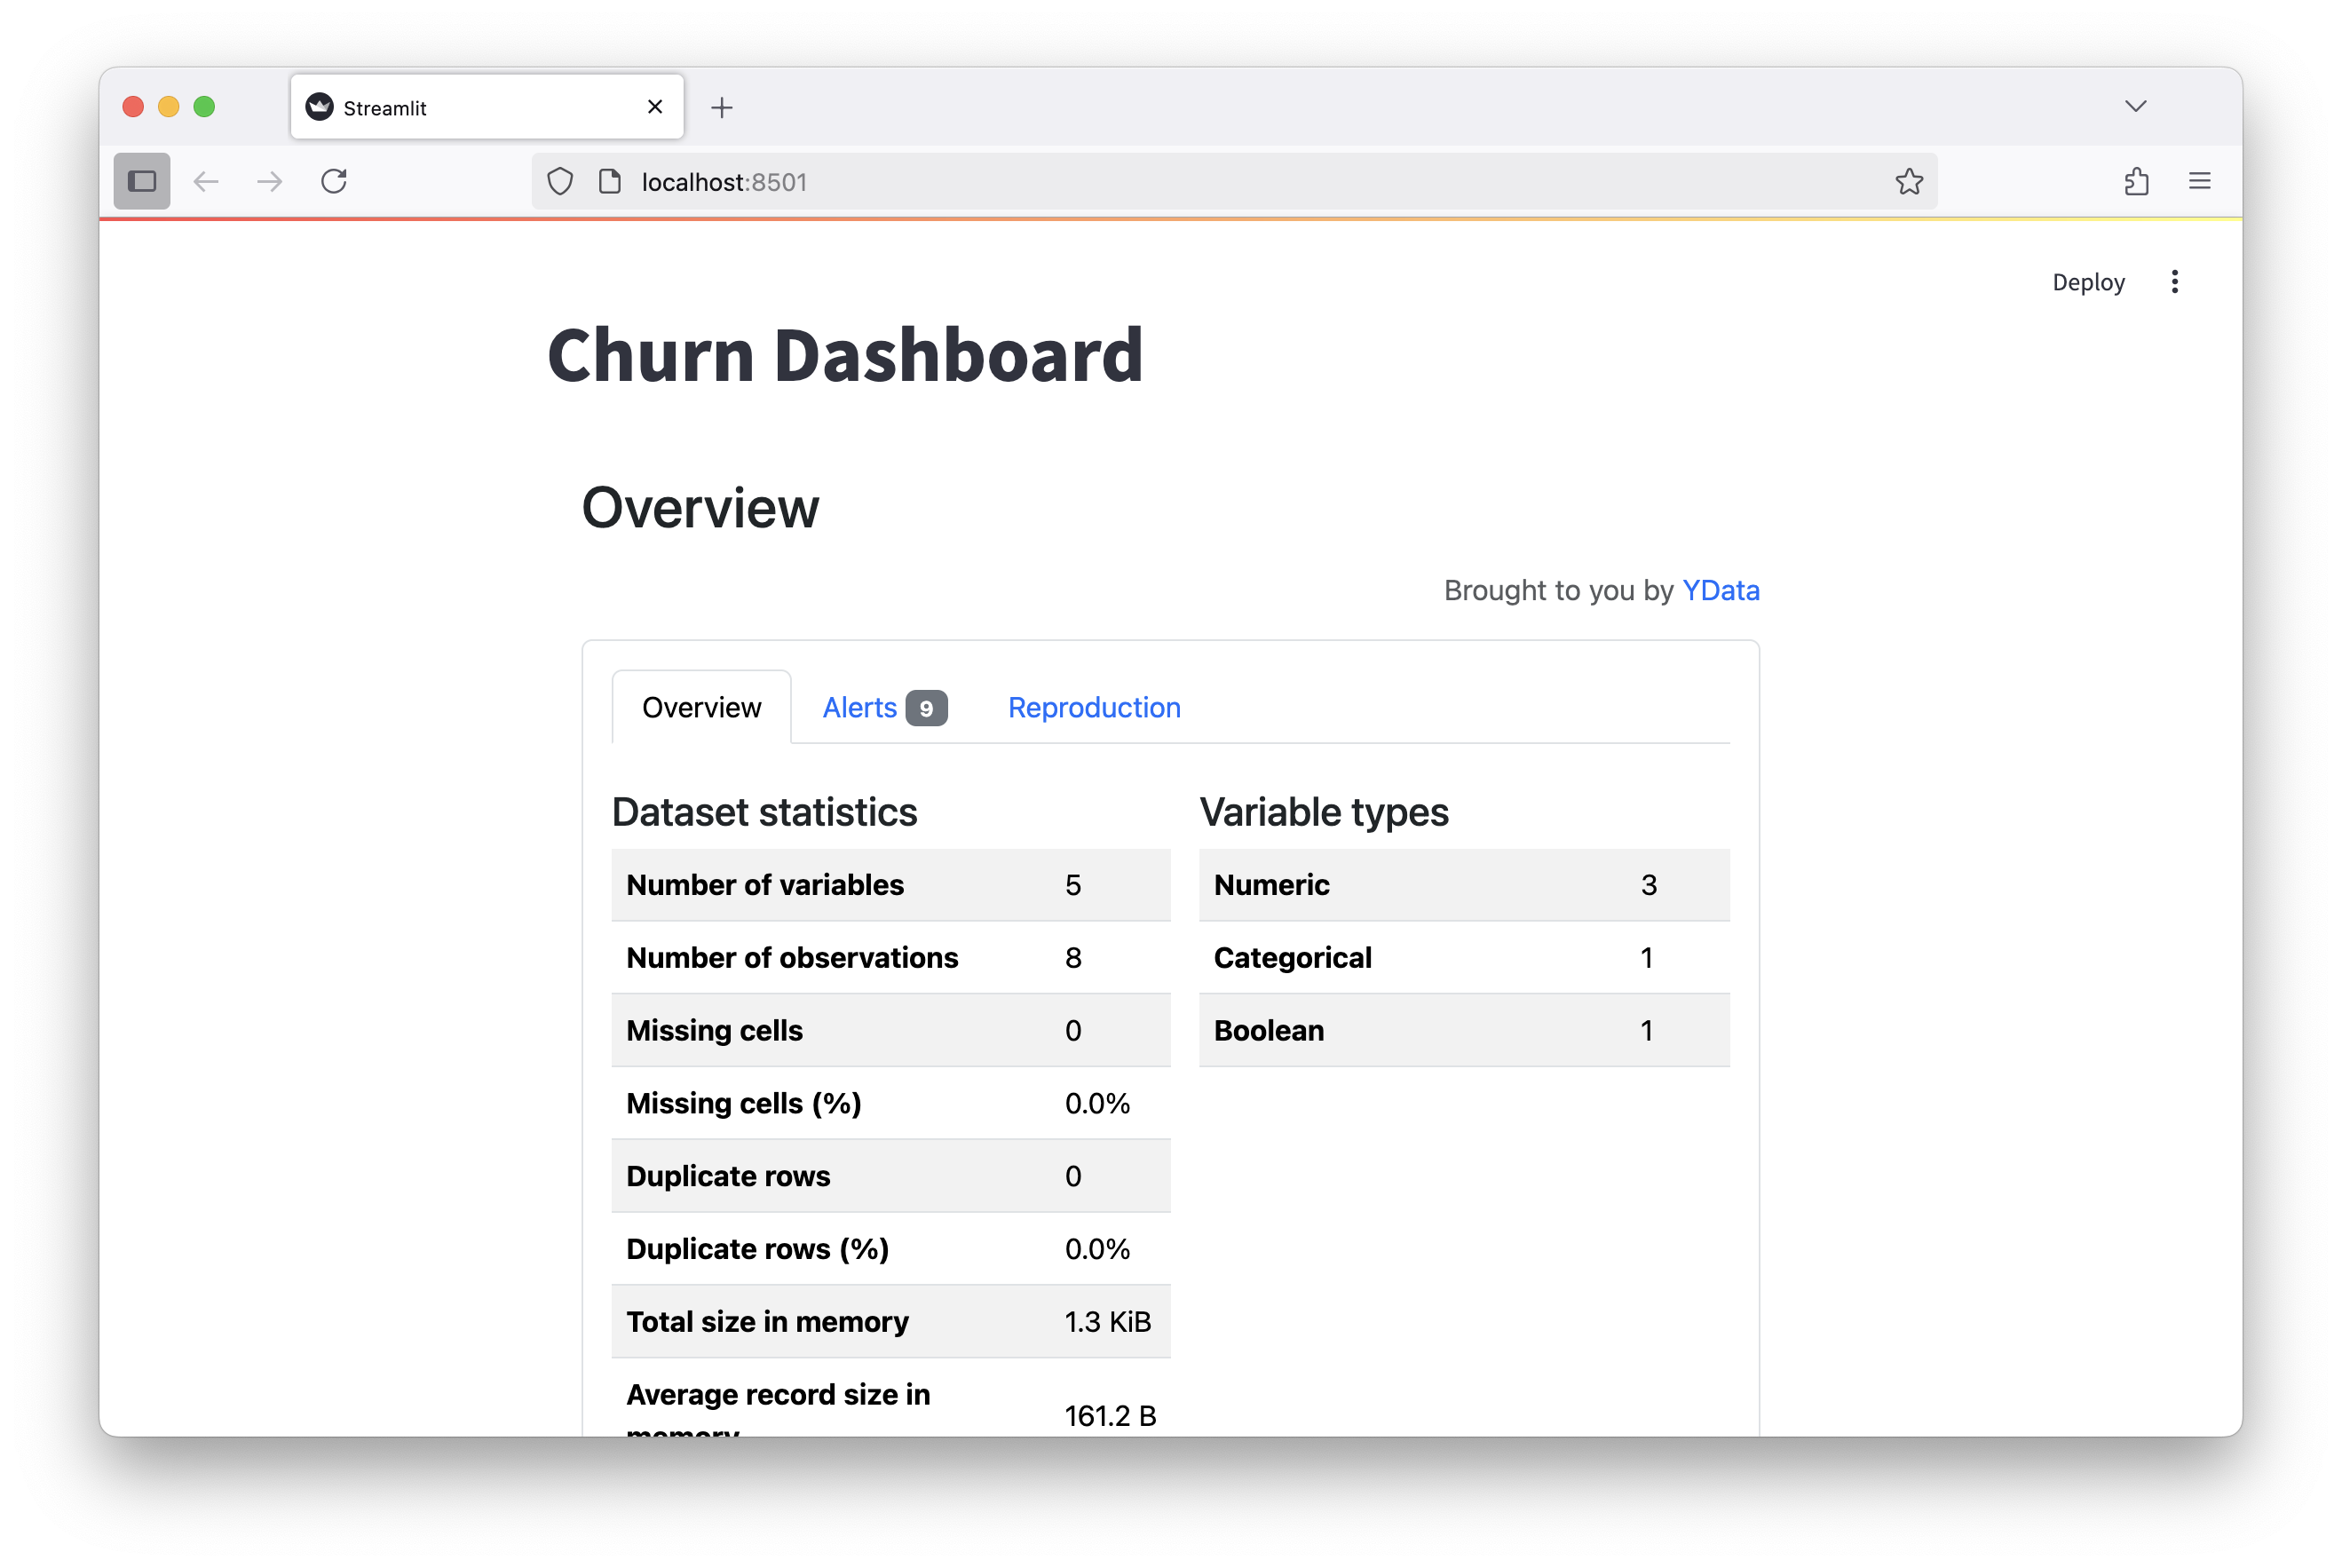
Bob Visualizes the Dataset
Bob installs his dependencies...
> pip install seaborn matplotlib streamlit...and creates a dashboard...
# app.py
import streamlit as st
import pandas as pd
import seaborn as sns
import matplotlib.pyplot as plt

st.title("Churn Dashboard")

# Load data
df = pd.read_csv("data/churn.csv")

# Create boxplot
st.subheader("Monthly Charges by Plan and Churn")
fig, ax = plt.subplots()
sns.boxplot(data=df, x="Plan", y="MonthlyCharges", hue="Churn", ax=ax)
st.pyplot(fig)
...and finally commits his changes...
> git add .
> git commit -m "feat: visualized customer churn data"
[feat/visualization 87dbac4] feat: visualized customer churn data
 1 file changed, 16 insertions(+)
 create mode 100644 app.py
Bob can view this Streamlit application using VSCode's Open in Browser feature:
> streamlit run app.py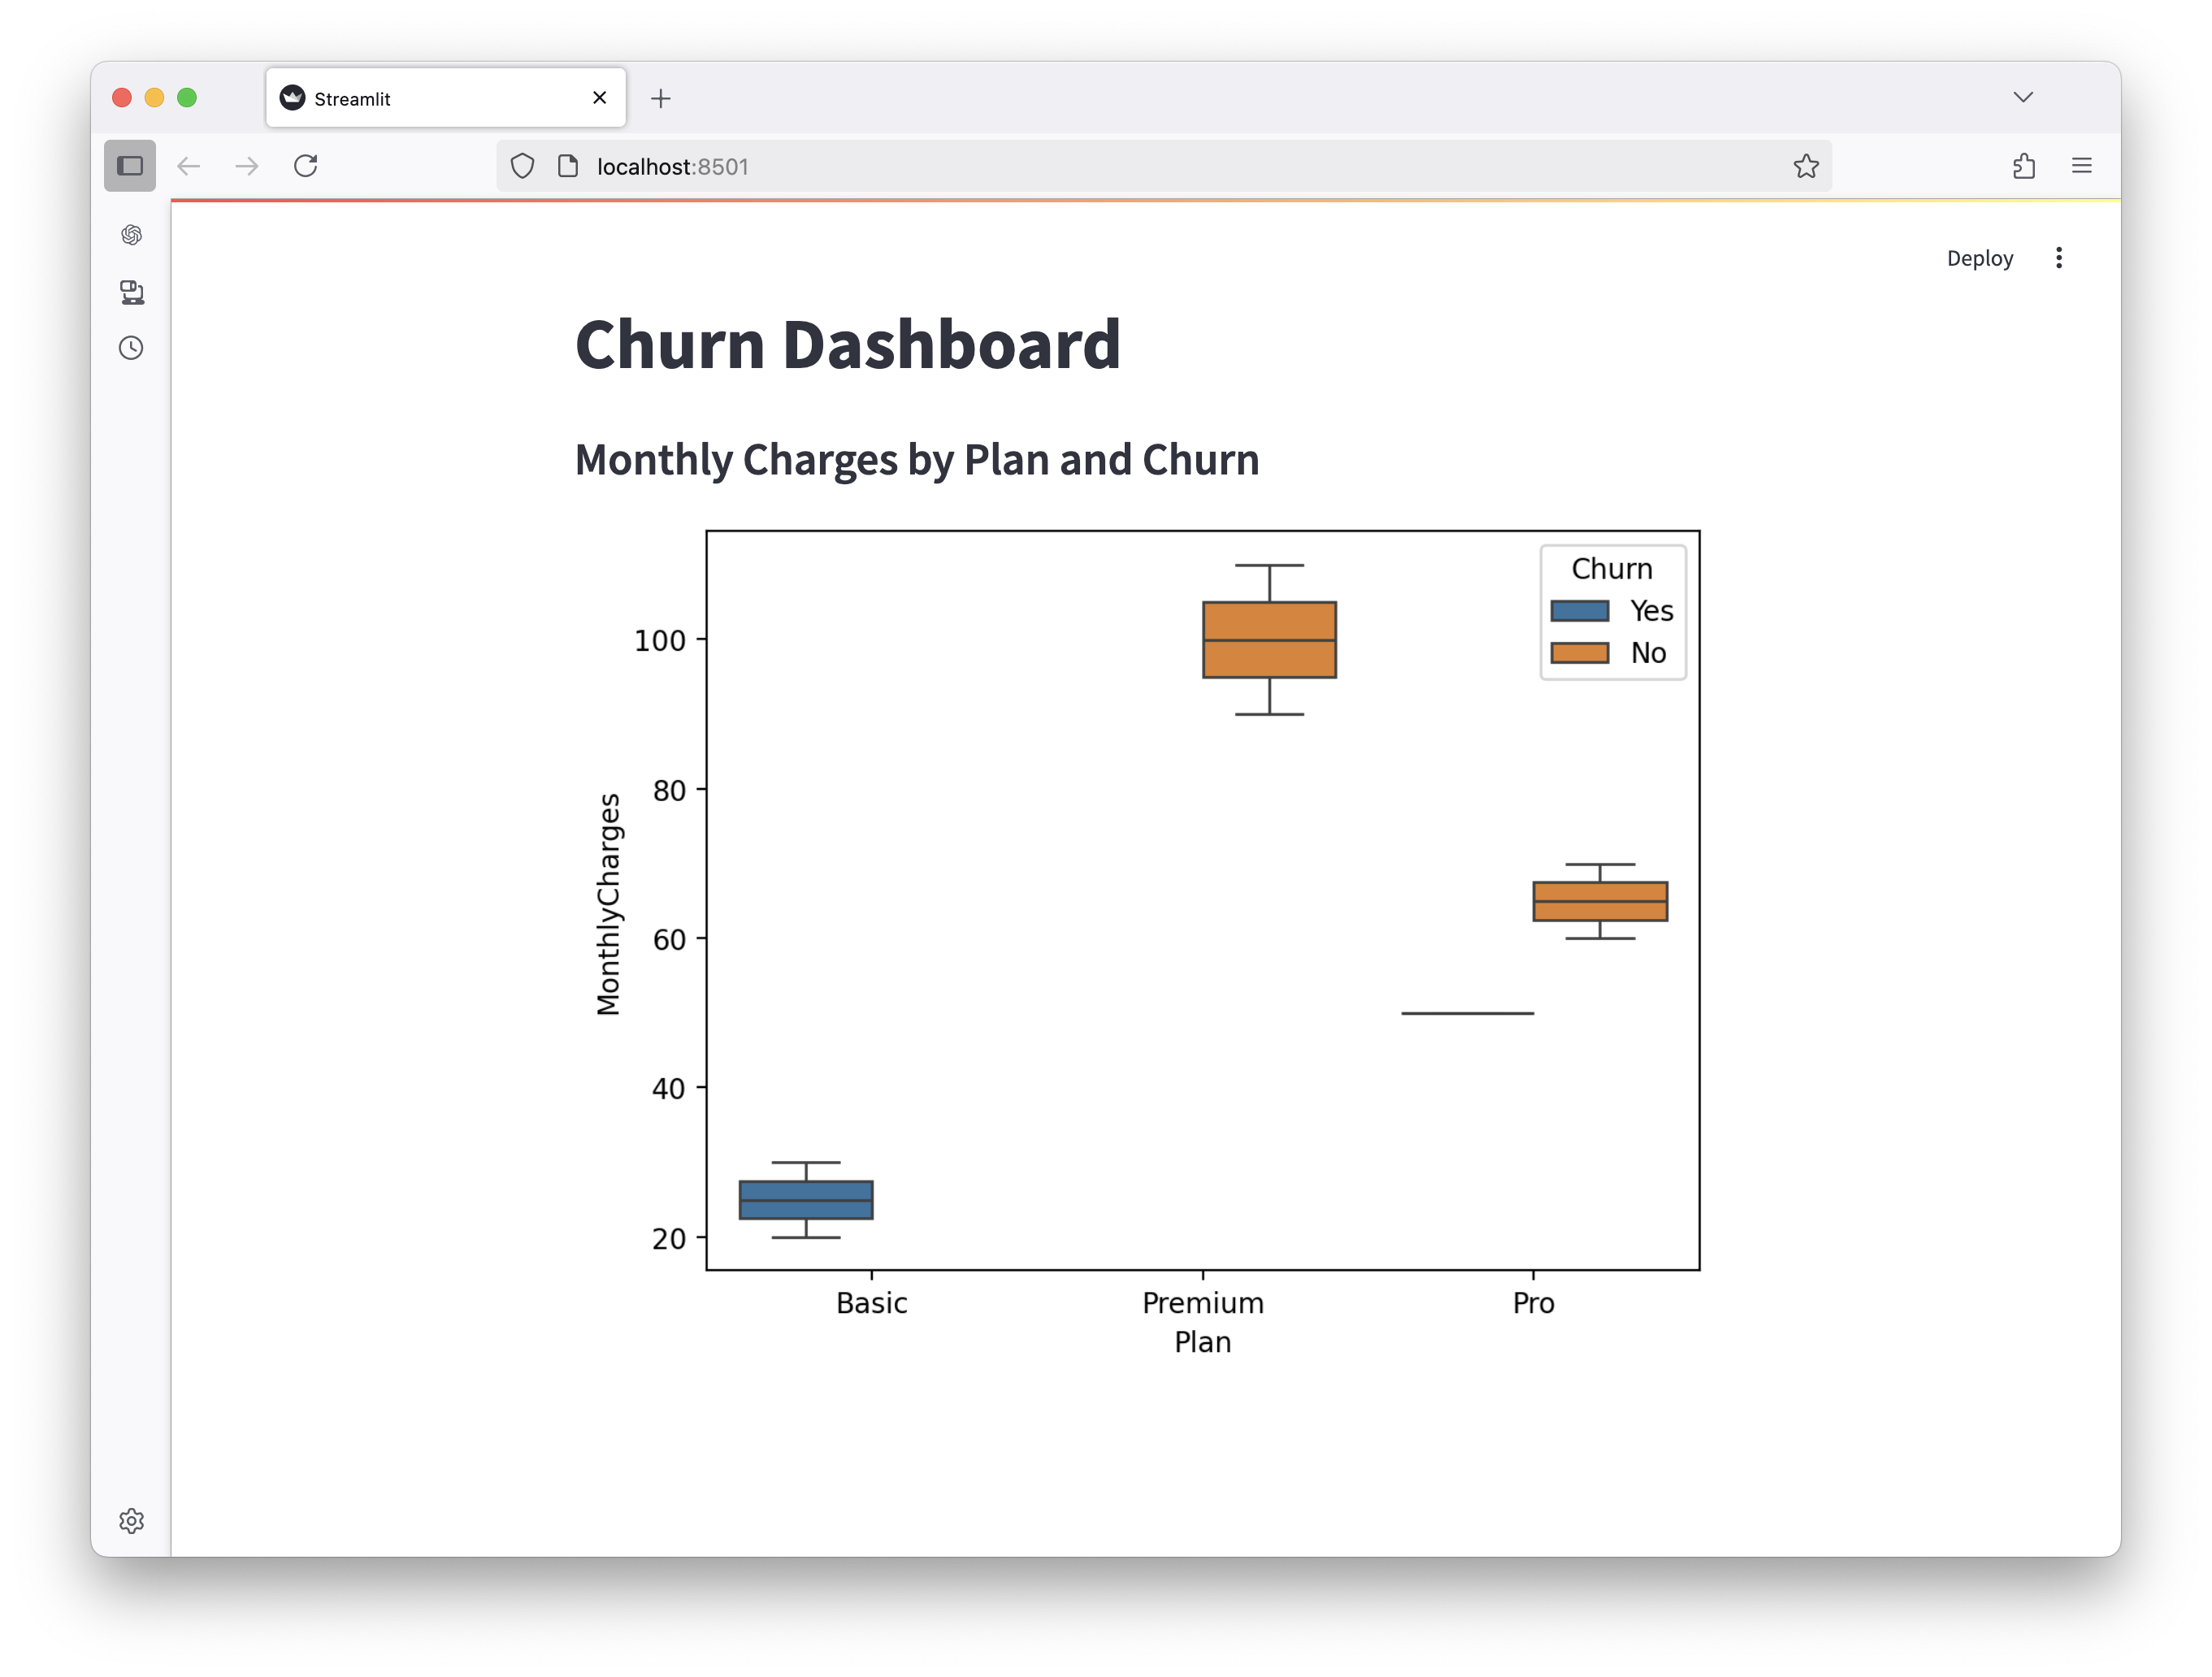
Review and Publish the Dashboard from a Space
Alice and Bob want to present their profile report and churn visualization together and decide to merge their work into a new branch. Alice manages merging their branches:
> cd ../../churn-dataset
> git worktree add ../worktrees/presentation -b presentation main
Preparing worktree (new branch 'presentation')
HEAD is now at 48cdaf5 feat: initial commit
> cd ../worktrees/presentation

# Merge Alice's profile
> git fetch ../profile feat/profile
From ../profile
 * branch            feat/profile -> FETCH_HEAD
> git merge FETCH_HEAD -m "feat: created profile report"
Updating 48cdaf5..070f89b
Fast-forward (no commit created; -m option ignored)
 app.py | 17 +++++++++++++++++
 1 file changed, 17 insertions(+)
 create mode 100644 app.py

# Merge Bob's visualization
> git fetch ../visualization feat/visualization
From ../visualization
 * branch            feat/visualization -> FETCH_HEAD
> git merge FETCH_HEAD -m "feat: added visualization"
Auto-merging app.py
CONFLICT (add/add): Merge conflict in app.py
Automatic merge failed; fix conflicts and then commit the result.
When resolving any conflicts, Alice edits app.py to include a way to switch between the profile report and the visualization:
import streamlit as st
import pandas as pd
import seaborn as sns
import matplotlib.pyplot as plt
from ydata_profiling import ProfileReport
from streamlit_pandas_profiling import st_profile_report

df = pd.read_csv("data/churn.csv")

st.title("Churn Dashboard")

# Added this
view = st.sidebar.radio("Select View", ["Data Profile", "Churn Visualization"])

# Added if/else to support both views
if view == "Data Profile":
    st.subheader("Dataset Overview")
    profile = ProfileReport(df, title="Churn Dataset Profile", explorative=True)
    st_profile_report(profile)

elif view == "Churn Visualization":
    st.subheader("Monthly Charges by Plan and Churn")
    fig, ax = plt.subplots()
    sns.boxplot(data=df, x="Plan", y="MonthlyCharges", hue="Churn", ax=ax)
    st.pyplot(fig)
And then Alice completes the merge:
> git commit -a
[presentation 200374c] feat: added visualization
From Bob's local machine he uses the PairSpaces CLI to open a port from the Space...
> pair space SPACE_ID --port 8501
Your Space is now available on port 8501, however, you must be authenticated in PairSpaces to access. Visit https://pairspaces.com/pairs/SPACE_ID to access your Space from this port.
...and from the Space, Alice serves the Streamlit application to the Product Marketing team...
> streamlit run your_app.py --server.address=0.0.0.0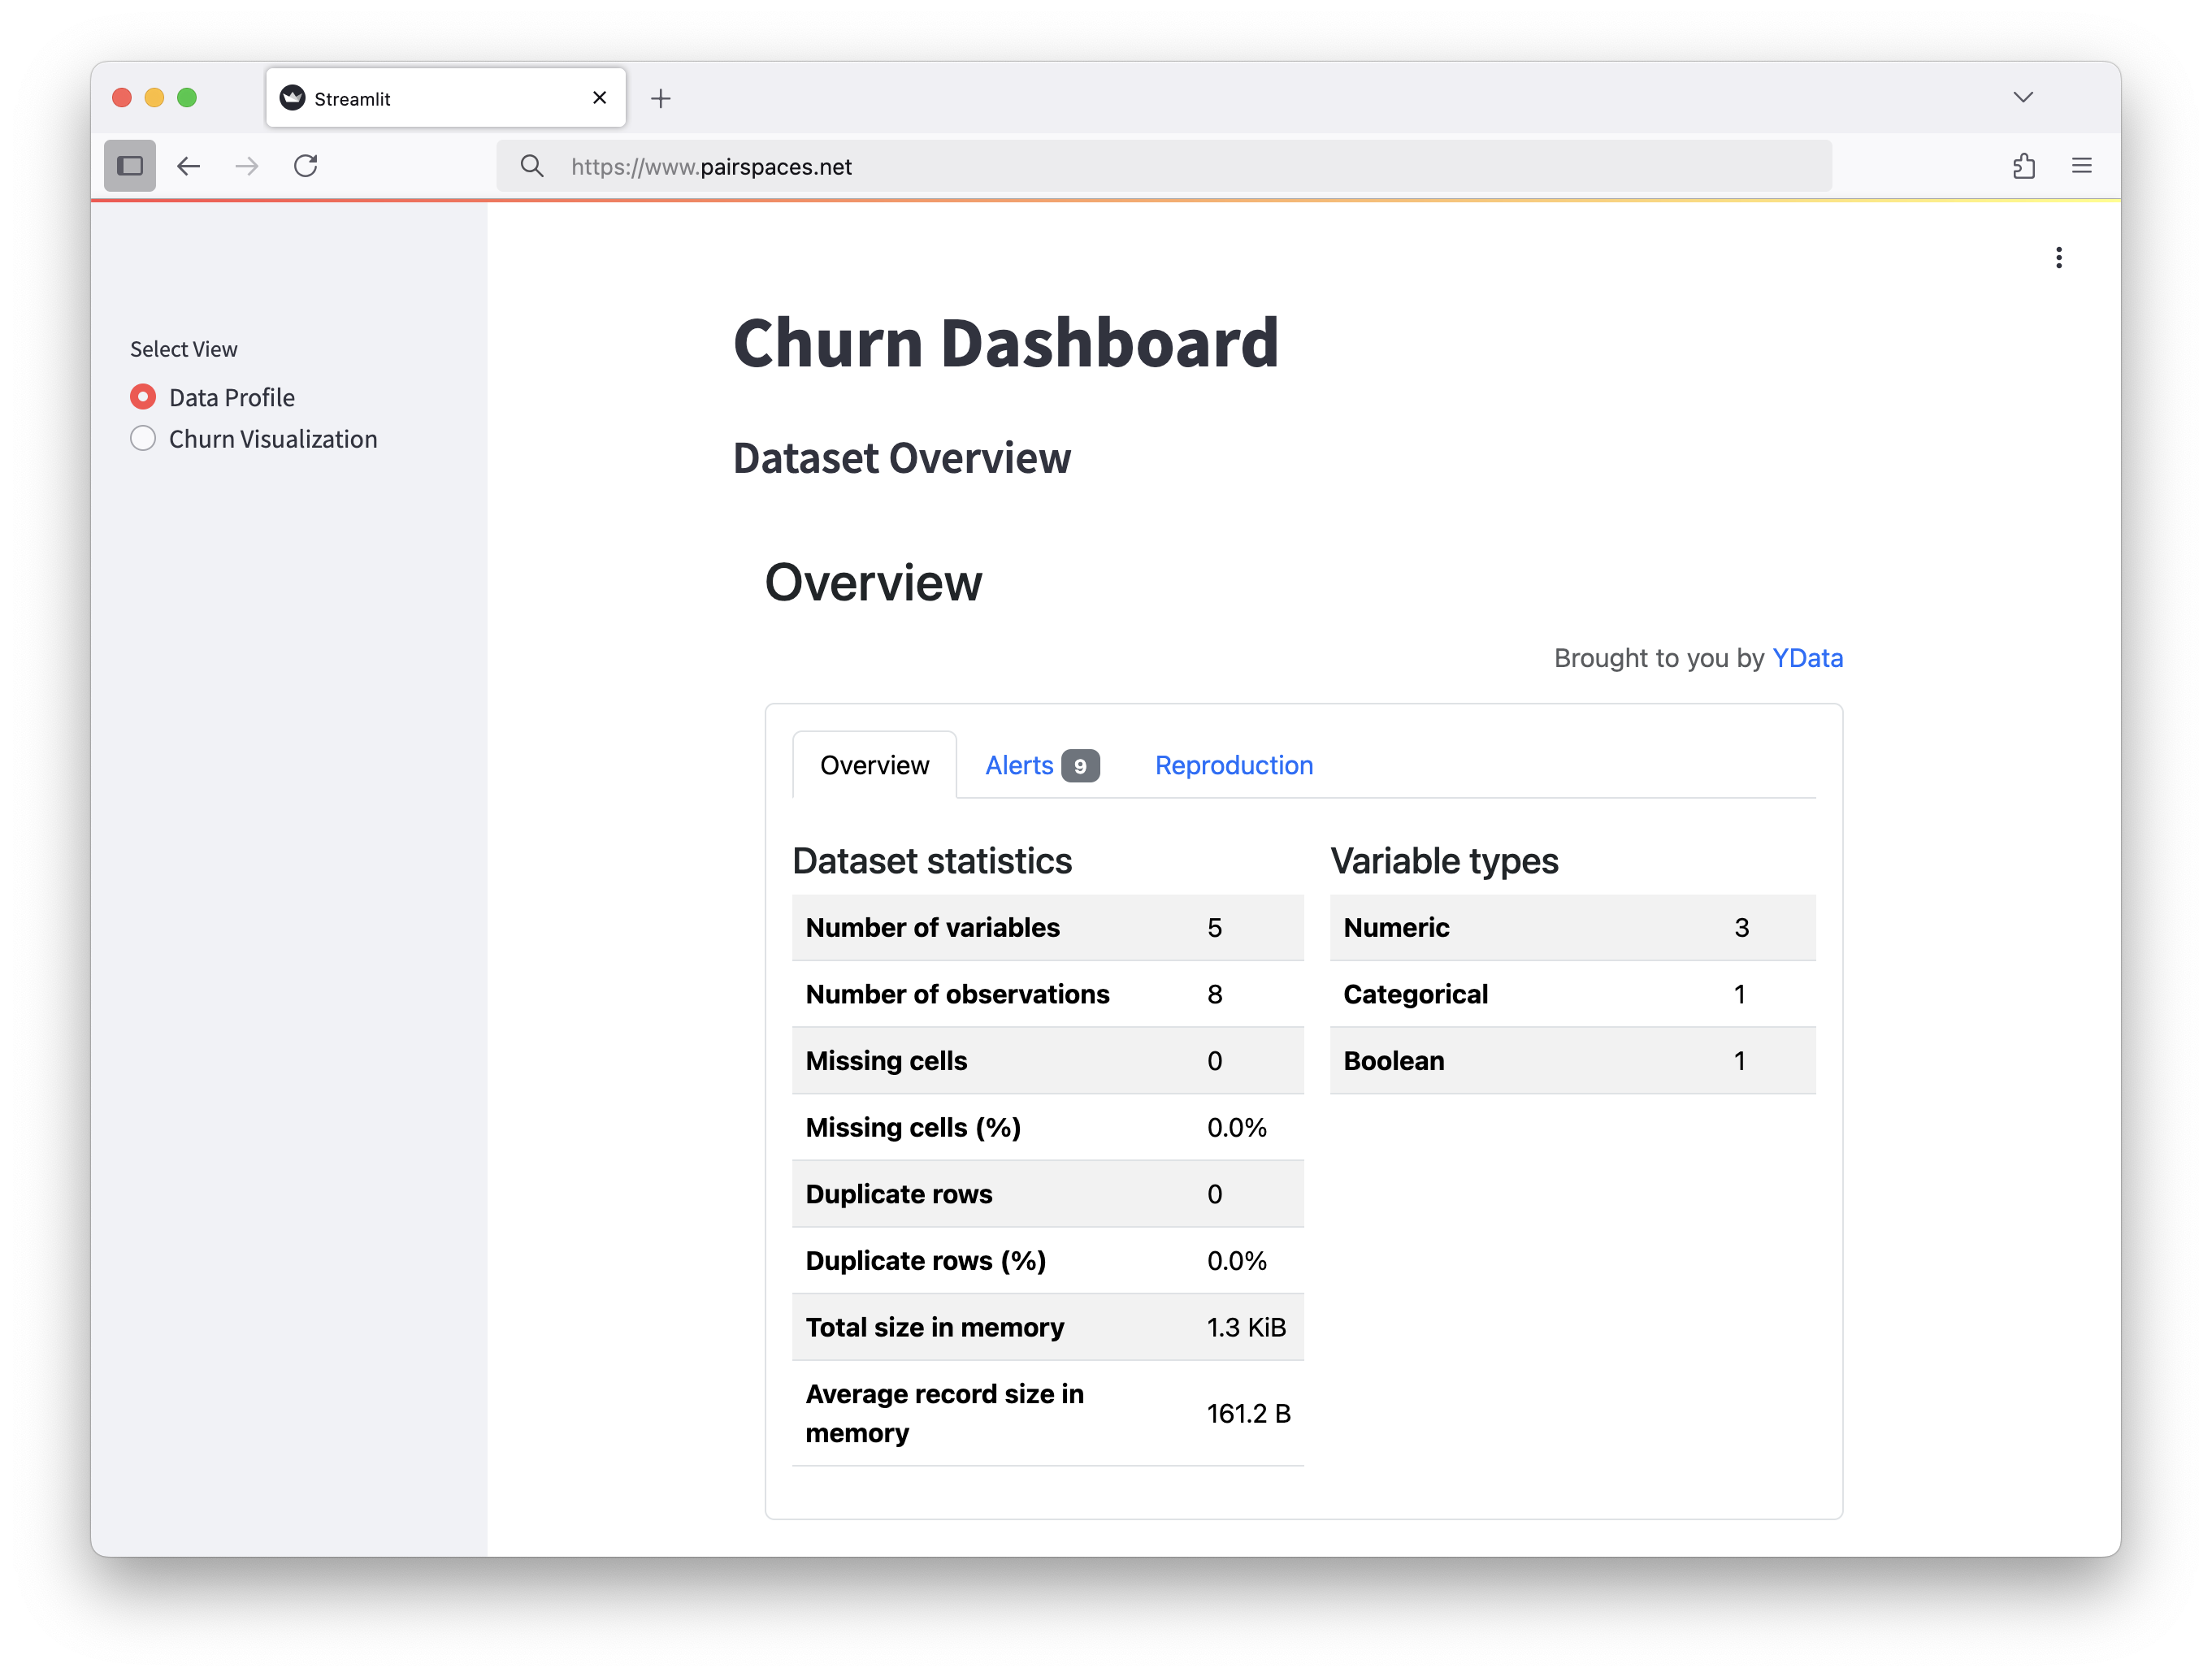
Create, Iterate, and Publish Securely from a Space
PairSpaces provides a single place for your team to work together. And PairSpaces comes with private networks out-of-the-box - only the people you share your Space with can see your data, whether that's collaborating on the data or accessing a dashboard.
It's never been easier to work together and get things done.
Try PairSpaces now.